 Measuring GHG emissions
February 10, 2022

Scope 3 emissions form the majority of a manufacturing company’s carbon footprint, capturing indirect greenhouse gases from value chain activities beyond direct control. Upstream categories (1–8) focus on emissions from all inputs and things your company buys or acquires) from supplier production and logistics to employee travel and waste disposal, often comprising 60–90% of total footprints. Accurate handling of these emissions drives regulatory compliance with regulations like CSRD or CBAM, supplier engagement, and real decarbonisation, turning complexity into opportunity.
This article tackles each of the eight upstream Scope 3 categories specifically for manufacturers, detailing what they include, key data sources, calculation approaches, and practical extra tips with real-world examples to guide accurate reporting and strategic action.
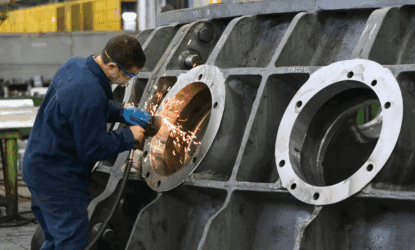
This category often dominates Scope 3 emissions for manufacturers, reaching up to 86%, as it tracks all upstream cradle-to-gate emissions from the production of goods and services purchased in the reporting year. These include raw materials, components, metals, plastics, as well as office supplies, furniture, consulting, auditing, IT support, and software licences—essentially any product or service acquired for business operations.
Data typically comes from ERP systems, purchase orders, invoices, or bills of materials. It includes expense data or invoices of purchased materials, as well as weight, volume, or quantity of purchased materials. Procurement, Finance, and Operations or Supply Chain teams are the primary data owners. When calculating emissions related to purchased and capital goods, Product Carbon Footprints (PCF) or Life Cycle Analysis (LCA) can be useful tools.
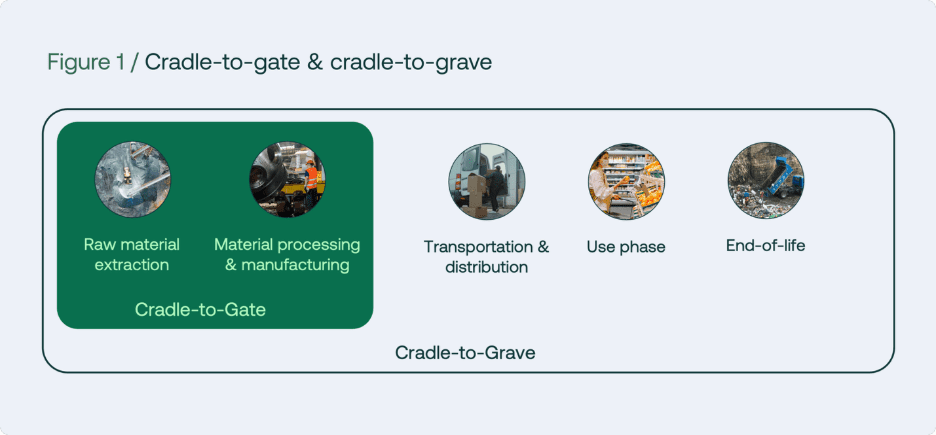
Product Carbon Footprints (PCFs) measure GHG emissions of a product or service across its life cycle—from raw materials to disposal. They relate to the product lifetime, can be cradle‑to‑gate or cradle‑to‑grave, and are expressed as emissions intensity (tCO₂e per product or functional unit).
Corporate Carbon Footprints (CCFs) quantify total GHG emissions from a company’s operations and value chain over a defined reporting period. They highlight emission hotspots, inform decarbonisation actions, and are expressed as total emissions (tCO₂e) per reporting period.
Life Cycle Assessments (LCAs) evaluate environmental impacts—such as carbon, water, and toxicity—across the full life cycle of a product or process, offering a broader scope than PCFs.
When referring to the lifecycle of a product the terms Cradle-to-Gate or Cradle-to-Grave are often used.
Consider a manufacturer purchasing ten conveyor belt modules as standard replacements for assembly line upgrades—these count as operating expenses under Category 1, not capital goods, since they’re not long-term fixed assets.
To estimate emissions, multiply the physical quantity by an industry-average emission factor, yielding 10×950 kg CO2e/piece=9,500 kg CO2e10×950kg CO2e/piece=9,500kg CO2e. Alternatively, using the spend-based approach on the total procurement cost gives \£25,000×0.60 kg CO2e/£=15,000 kg CO2e\£25,000×0.60kg CO2e/£=15,000kg CO2e. This variance underscores prioritising supplier-provided Product Carbon Footprints (PCFs) or DEFRA factors over averages for credible reporting.
Capital goods encompass long-lived assets like buildings, facilities, heavy machinery, IT infrastructure, hardware, or company vehicles—final products with extended life used in core operations, treated as depreciating fixed assets in financial accounting. The GHG Protocol requires reporting all upstream cradle-to-gate emissions in full during the purchase year, not amortised over usage, to align carbon and financial boundaries and prevent double-counting with Category 1.
Distinguish these from regular purchases via ERP purchase orders; exclude transportation emissions (report in Category 4). Calculation mirrors Category 1: supplier-specific primary data or average-data LCA factors applied to quantities, ensuring consistency across procurement records.
This category covers all upstream well-to-tank emissions tied to fuels and utilities purchased and consumed in the reporting year, including extraction, production, transportation of fuels like coal, gasoline, natural gas, or biofuels, plus upstream activities and transmission/distribution (T&D) losses for electricity, steam, heating, and cooling. For manufacturers, this separates supply chain impacts from on-site Scope 1 combustion or Scope 2 generation.
Data sources include fuel consumption in litres or energy use in kWh. Supplier-specific methods use provider data on upstream emissions; average-data applies regional factors covering extraction, refining, and T&D (e.g., DEFRA for fuels, IEA for electricity), prioritising primary data for accuracy in energy-intensive operations.
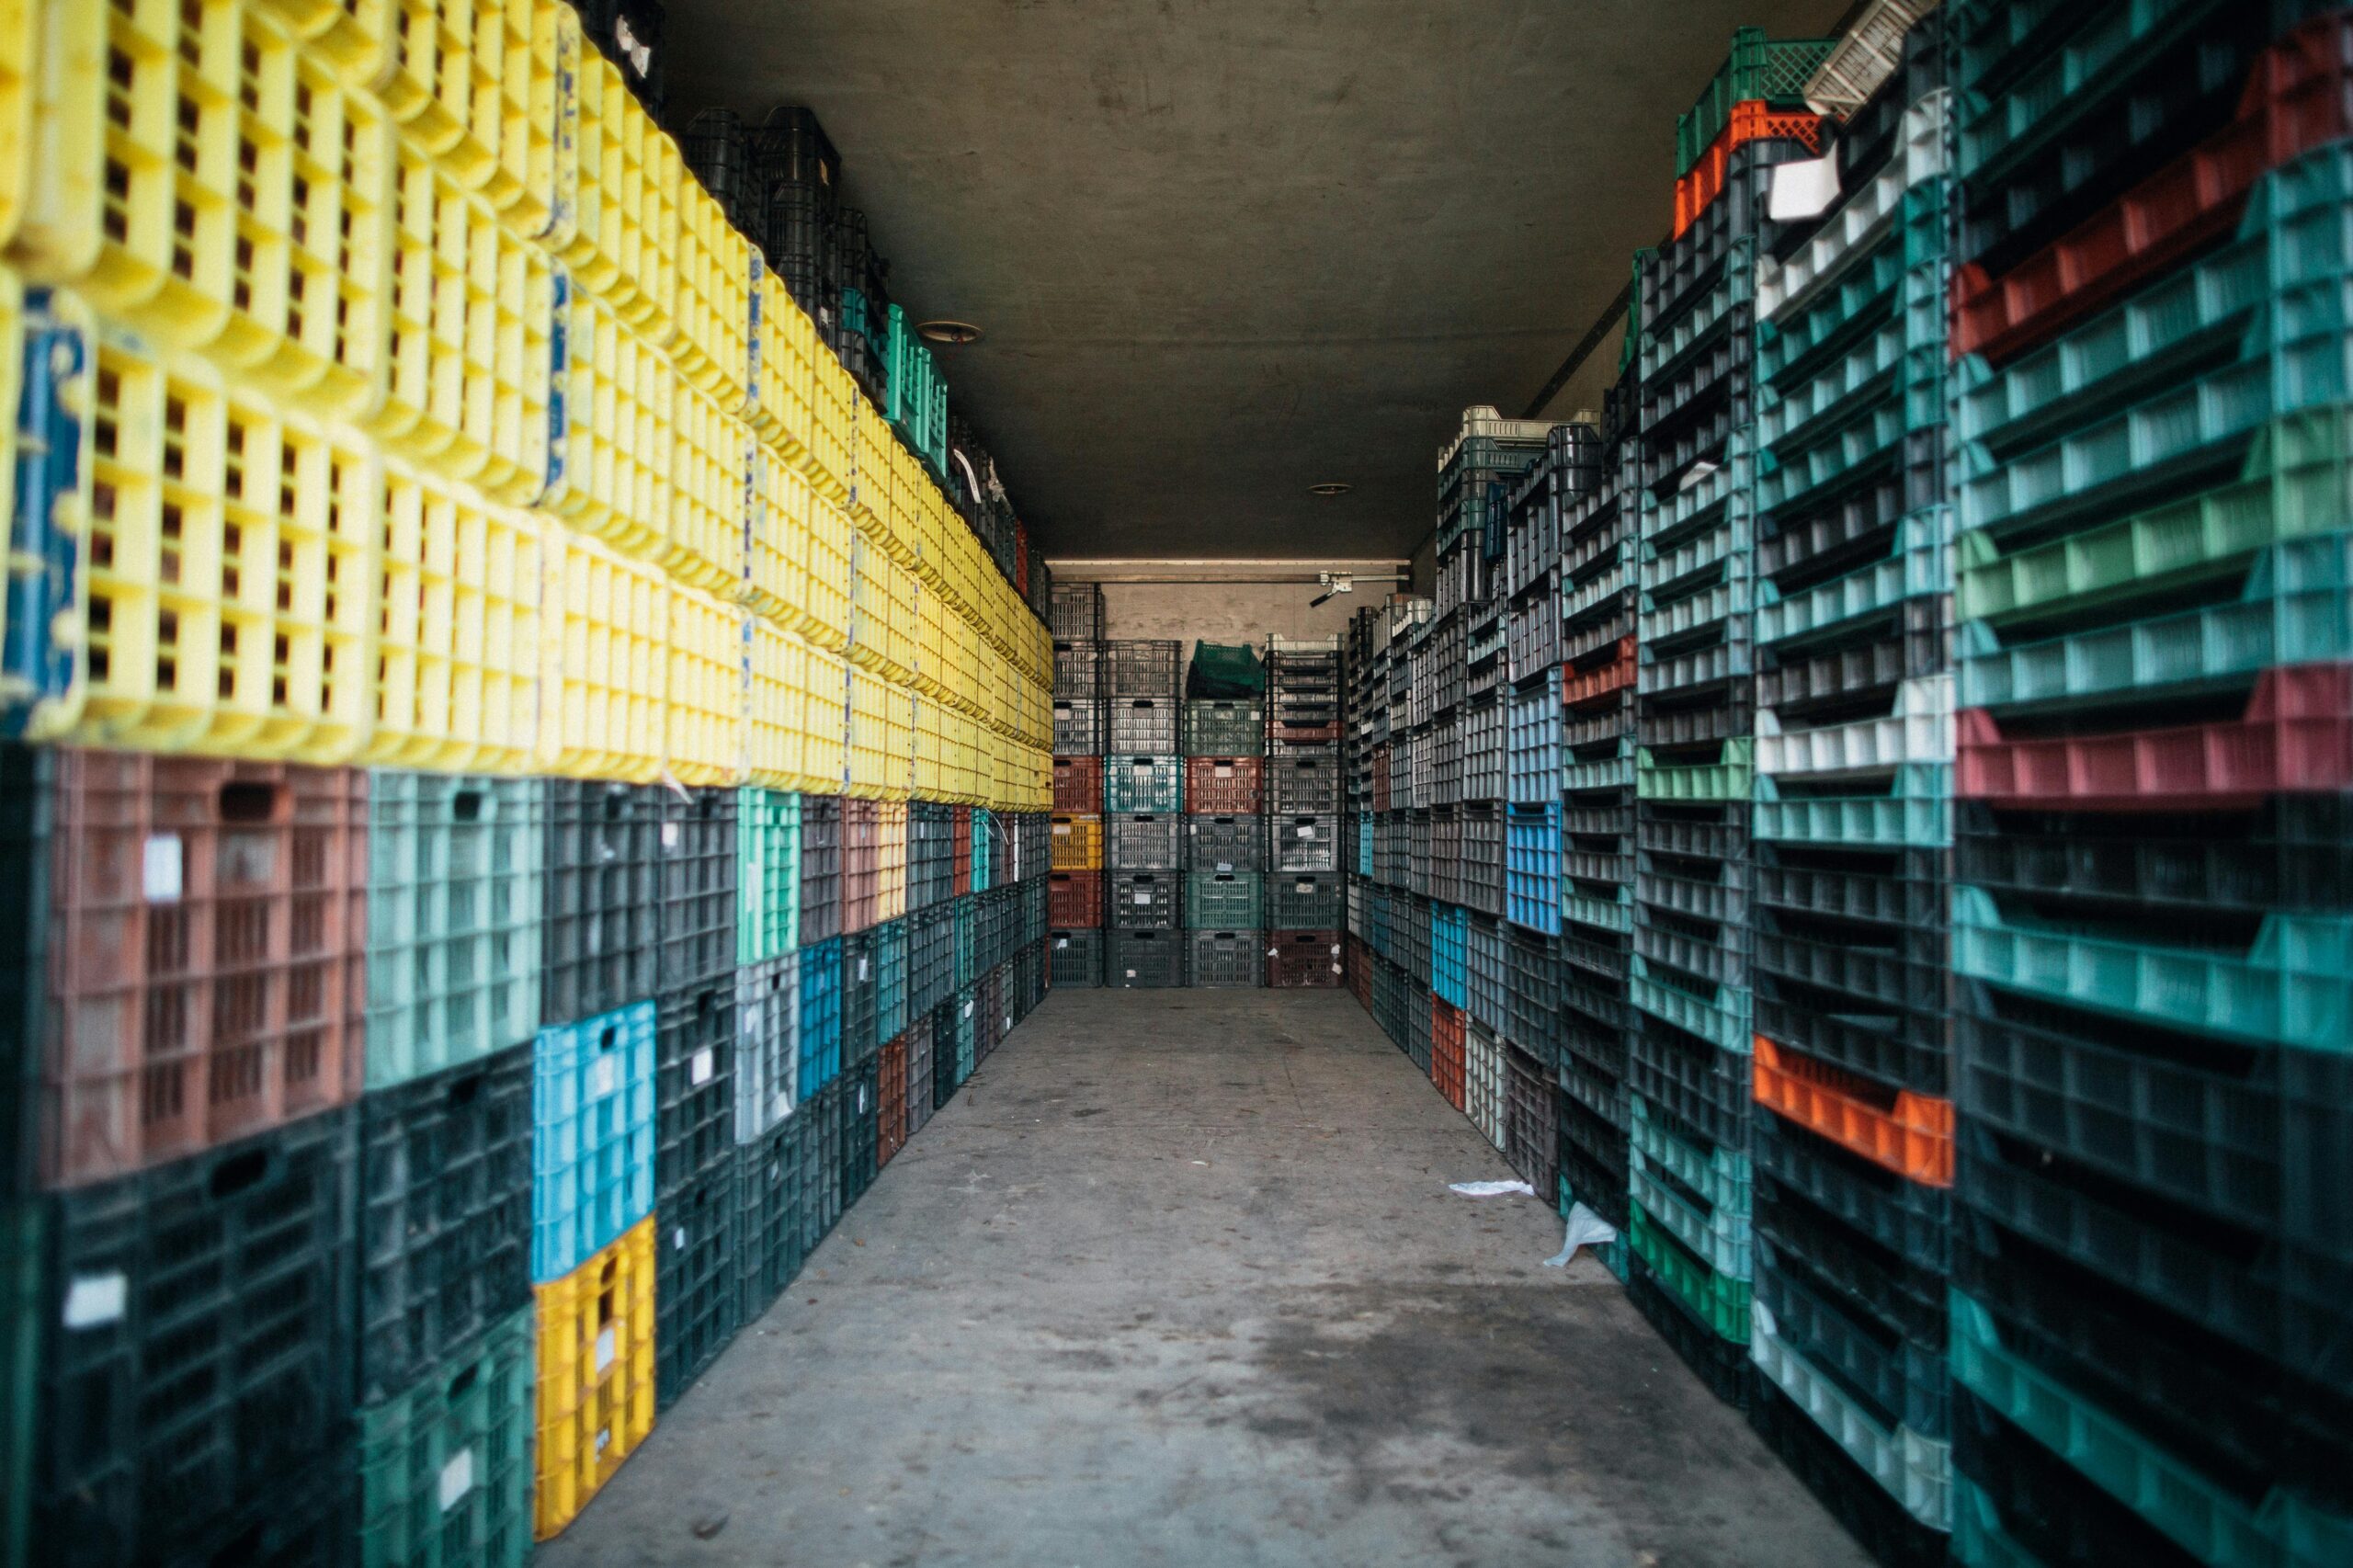
Category 4 captures emissions from transportation and distribution services paid for by the company, including inbound logistics from suppliers, inter-facility transfers, and storage in third-party warehouses or vehicles (road, rail, sea, air freight)—not owned or controlled by the reporting company. A key distinction: if the manufacturer pays for outbound transport to customers, it stays upstream here; customer-paid transport falls to Category 9 downstream.
Common data includes fuel logs, tonne-km distances, or spend. Fuel-based measures direct consumption; distance-based uses weight/distance with factors like kg CO₂e/tonne-km or TEU-km; spend-based applies EEIO models as a less precise fallback. Specialised sources like GLEC enhance transport precision.
Emissions stem from third-party disposal and treatment of waste generated in operations—production scrap (metal cuttings, faulty parts), packaging (plastic, cardboard, pallets), electronic waste (devices, batteries), wastewater/sludge from cleaning/cooling, or general refuse—recorded in the generation year, even if treated later. Treatment methods like landfill (high methane risk), incineration, recycling, composting, waste-to-energy, or wastewater processing drive varying footprints.
Data tracks volumes by type and method. Supplier-specific uses treatment providers’ Scope 1/2 data; waste-type-specific applies precise factors per waste-treatment combo; average-data aggregates by treatment proportions. Note GHG Protocol boundaries: include recovery emissions here, but exclude recycling credited to the next product life in Category 1.
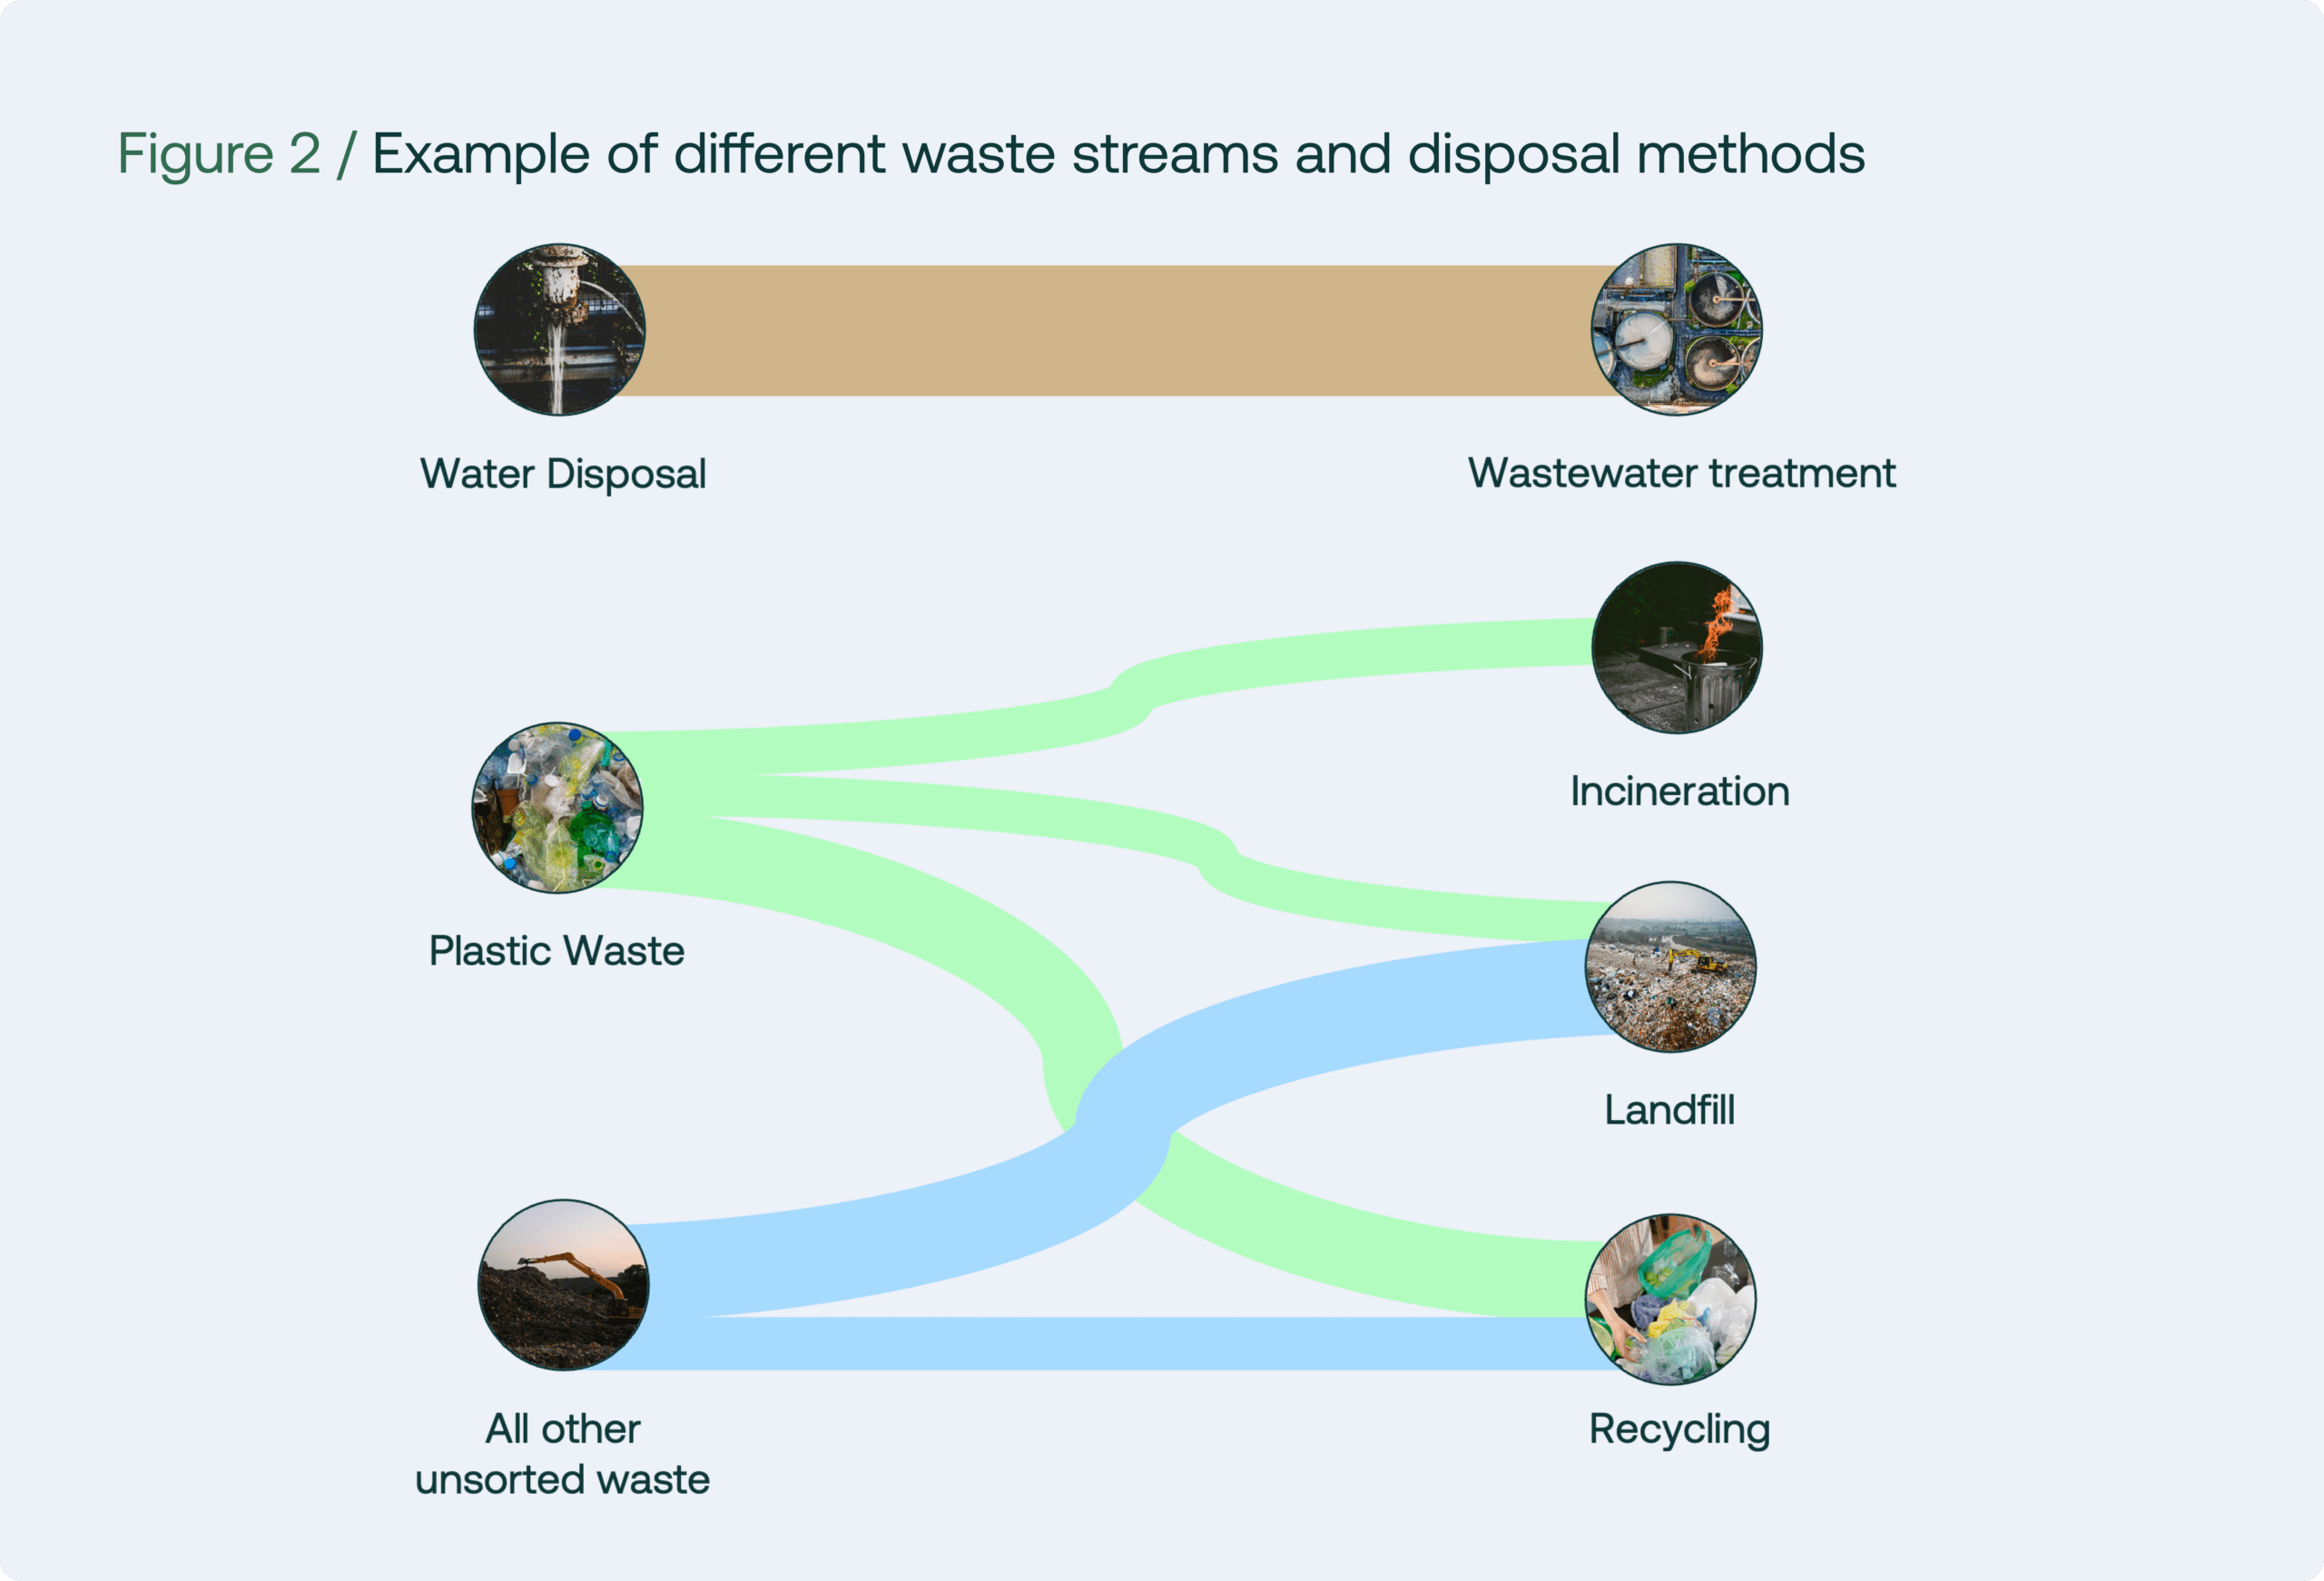
In the manufacturing industry, common types of waste include:
This includes emissions from employee business transportation in non-company vehicles: flights, trains, taxis, or reimbursed personal cars, optionally extending to accommodation. Data from fuel receipts, distances, or expense claims by mode supports estimation.
Fuel- or distance-based methods lead, with spend-based via reimbursements as fallback; verify third-party calculations (e.g., airline data) against GHG Protocol. National databases or DEFRA provide reliable factors.
Covers home-to-work and remote work transport emissions, estimated via surveys capturing round-trip distances, modes (car, public transport), working weeks, and frequency—extrapolate representative samples (e.g., 75%+ completion for small firms, scaled across departments for larger ones).
Distance- or average-data from surveys preferred; fuel-based where reimbursements exist. UK, US, or DEFRA factors suit most manufacturers.
Operational emissions from leased assets not owned or financially controlled—like rented machinery, warehouses, or vehicles under operating leases—covering fuel combustion, electricity, steam, or fugitive refrigerants, but excluding embodied manufacturing (Categories 1/2). Boundaries vary: finance leases often shift to Scope 1/2 under financial control; operational control typically includes them there unless justified otherwise.
Asset-specific uses direct consumption; lessor-specific prorates total energy by area/volume; average-data baselines by asset type.
Picture a manufacturer leases two machines that run all year:
Their annual emissions are calculated as:
Total annual emissions = 6,044 kg CO₂e
Even without detailed sub-metering, using standard electricity grid and fuel emission factors lets lessors estimate emissions and identify opportunities to improve machine efficiency.
Mastering these categories reveals manufacturer hotspots—materials, energy, waste—for targeted supplier engagement under CSRD/CBAM mandates. Primary data from ERP systems, fuel logs, and partners, bolstered by DEFRA/IEA emission factors and hybrid approaches, ensures robust inventories. Transparent boundaries prevent common errors like double-counting capital goods or misallocating transport, while consistent methodologies align climate data with financial records for stakeholder trust.
Ultimately, Scope 3 accounting transforms from a compliance burden into a strategic advantage. By prioritising supplier-specific data, conducting regular employee surveys, and leveraging tools like PCFs and LCA databases, manufacturers can drive value chain decarbonisation. This not only meets regulatory demands but positions companies as leaders in sustainable production, fostering innovation in procurement, logistics, and operations on the path to net zero.
We are an international sustainability consultancy dedicated to guiding organisations from compliance to purpose-driven sustainability. With a pragmatic, step-by-step approach, we provide expert support across strategy development, ESG ratings, climate solutions, and comprehensive sustainability reporting to help clients achieve their net zero goals.
Our team of 15+ highly skilled climate experts, equipped with deep knowledge of company processes and data architecture, partners with you to measure your full GHG inventory, set science-based targets, and map a tailored decarbonisation roadmap. We’ve supported 100+ clients across 20+ sectors, including manufacturing, shipping, logistics, professional services, and food & beverage. We help your carbon accounting and reduxtion through:
From initial footprint assessment to ongoing reductions, Nexio Projects transforms complexity into actionable progress on your climate journey.
Contact our climate experts for a free consultation now.
Subscribe to our newsletter for more industry insights, climate insights and ESG news!