ESG leadership for manufacturers: Key trends and best practices
November 19, 2025


A growing share of the logistics industry’s climate impact lies in value-chain activities not directly controlled by operators, but strongly shaped by their decisions. Every subcontracted carrier, leased depot, and fuel supplier contributes to an emissions footprint that most transport companies have only recently begun to map.
According to CDP, corporate supply chain emissions are on average 26 times higher than direct operational emissions [1]. Yet these upstream figures are often the last to be measured and the first to be underestimated. For logistics companies, Scope 3 is especially relevant due to their involvement in international trade, multimodal transportation and outsourced services. This gives logistics operators a unique position to make an impact on global decarbonisation efforts [2].
This guide walks through each upstream Scope 3 category with logistics-specific context, practical calculation methods, and worked examples drawn from real-world operational data. It follows the structure of Nexio Projects’ sector guides for chemicals and manufacturing, extending the series to one of the most emissions-intensive sectors in the global economy.
For a typical logistics company, Scope 3 emissions account for the vast majority of total greenhouse gas (GHG) emissions. Scope 1 covers direct emissions from company-owned or controlled vehicles and facilities. Scope 2 captures indirect emissions from purchased electricity and energy. Scope 3 covers all other indirect value-chain emissions, and for logistics, this is where the footprint lives.
For most industries, 75 to 95% of total emissions arise from value-chain activities [3]. In logistics, that share typically sits at the higher end, given the sector’s heavy reliance on subcontracted transport, third-party warehousing, and purchased fuel supply chains. Any credible decarbonisation strategy must therefore treat Scope 3 emissions as the primary focus, not a secondary consideration.
Within Scope 3, Category 4: Upstream Transportation and Distribution is the dominant category for logistics companies. It typically accounts for around 60 to 80% of total Scope 3 emissions, reflecting the sector’s reliance on extensive freight networks and subcontracted carriers operating trucks, ships, trains, and aircraft. Source: Nexio Projects anonymised client data.
Category 3: Fuel and Energy-Related Activities contributes a further 10 to 30%, driven by the upstream extraction, production, and transportation of fuels consumed in logistics operations. Category 2: Capital Goods accounts for approximately 5%, representing the embodied emissions from vehicles, containers, and material-handling equipment purchased in the reporting year.
This profile is illustrative. A cold-chain provider, a parcels network, and a bulk freight carrier each face a different emissions distribution. Distribution will also vary based on how much transport is performed with the company’s own vehicles and equipment versus subcontracted to third-party carriers.
Download our guide on supply chain emissions to understand Scope 3 strategies further.

Upstream Scope 3 covers Categories 1 to 8, from purchased goods and energy inputs to transportation, waste, business travel, commuting, and leased assets. In logistics, Categories 3 and 4 are typically the most material and should anchor any inventory build. The remaining categories are smaller in absolute terms but are required for a complete inventory under the GHG Protocol [3], and are increasingly scrutinised under CSRD and SBTi frameworks [4].
Category 1: Purchased Goods and Services covers all upstream cradle-to-gate emissions from products and services acquired in the reporting year. For logistics companies, this includes vehicle consumables such as tires, lubricants, and filters, as well as packaging materials, IT services, and office supplies. Any product or service purchased for business operations falls within this category.
Category 2: Capital Goods covers long-lived assets — trucks, shipping containers, forklifts, warehouses, and IT infrastructure — treated as fixed assets with a depreciating value in financial accounting. The GHG Protocol requires all upstream emissions associated with these assets to be reported in full during the year of purchase, rather than spread across the asset’s useful life [3].
When distinguishing capital goods from purchased goods, companies should apply the same capitalisation rules used for financial reporting. This ensures consistency and avoids double counting. Emissions from the transportation of purchased goods to the company’s facilities should be reported in Category 4, not within Categories 1 or 2. Misallocating transport emissions between categories is one of the most common errors in Scope 3 accounting.
Consider a logistics company purchasing eight heavy-duty truck tires as standard fleet maintenance. Recorded as an operating expense, these fall under Category 1: Purchased Goods and Services rather than as capital goods.
Using the average-data method: 8 pieces × 320 kg CO₂e/piece = 2,560 kg CO₂e.
The spend-based method applied to the total procurement cost gives: $6,400 × 0.40 kg CO₂e/$ = 2,560 kg CO₂e.
This alignment between methods is not always the case. Supplier-specific Product Carbon Footprints are preferable where available, as they capture actual production emissions for the specific goods purchased.
Category 3 covers all upstream emissions from the extraction, production, and transportation of fuels and utilities purchased and consumed in the reporting year. For logistics operators, this primarily includes the upstream supply chain of diesel, HVO, liquefied natural gas (LNG), and other fuels used across the fleet, as well as electricity consumed in warehouses and distribution centres.
A common point of confusion is the boundary between Scope 1 and Category 3. Scope 1 covers direct fuel combustion the Tank-to-Wheel portion. Category 3 covers what happens before that combustion: the Well-to-Tank chain of extraction, refining, and transportation. Both must be measured for a complete inventory.

For electricity, Category 3 includes the upstream extraction and production of fuels used to generate that electricity, as well as transmission and distribution losses. These emissions are calculated using the same consumption data as Scope 2, kilowatt-hours of electricity, litres of fuel. However, with different emission factors that capture upstream rather than combustion impacts.
The UK Government DEFRA database is a high-quality and globally applicable fallback for fuel emission factors [6]. IEA is the recommended source for electricity [7]. Supplier-specific emission factors should be prioritised where available.
“Category 4 is where the logistics sector’s commercial position and its climate obligation converge. When manufacturers and retailers calculate their own Scope 3, the logistics provider is the data source. Measuring well is a quality signal to every customer running their own emissions inventory.”
Category 4 is the most material upstream Scope 3 category for logistics companies, typically representing 60 to 80% of total Scope 3 emissions. It captures all emissions from transportation and distribution services paid for by the reporting company, including inbound and outbound freight, inter-facility transfers, and storage in third-party warehouses and terminals not owned or controlled by the reporting company.
Transport modes include road, rail, sea, and air freight. Distribution activities cover warehousing, cold stores, and any other storage facility the reporting company pays to use.
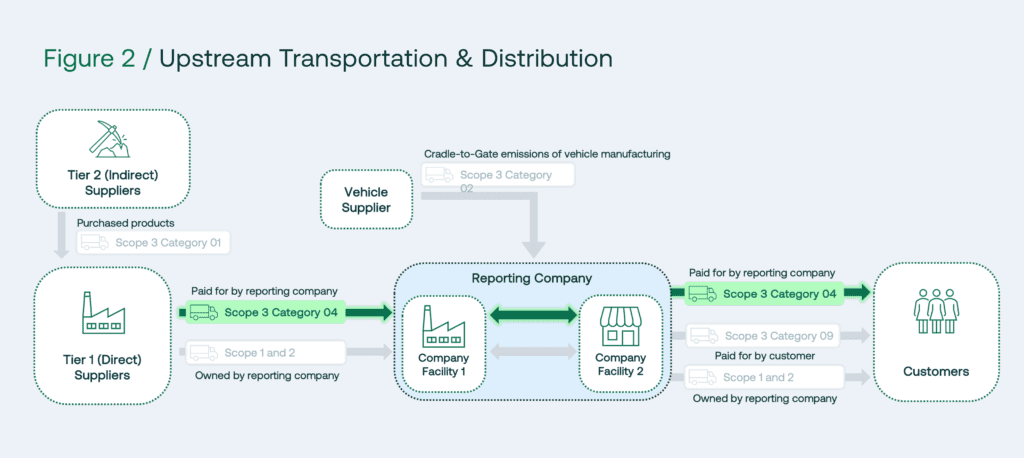
A boundary distinction that often causes confusion: if the logistics company pays for transport, those emissions are Category 4, regardless of whether the freight moves inbound or outbound. Important to note that Inbound transportation of purchased goods should always be reported under Category 4, even if the reporting company does not explicitly pay for it. If the customer arranges and pays for transport, those emissions fall under the customer’s own Category 9: Downstream Transportation and Distribution [3]. Clear contractual clarity on who bears transport costs is therefore essential for correct allocation.
For cold-chain operators, refrigerant leakage requires specific attention. Refrigerant gases escaping from temperature-controlled vehicles or storage units carry high global warming potentials. Leakage is typically estimated using refilling data: the amount of refrigerant replaced during annual servicing is used as a proxy for leakage over that period.
Three main calculation approaches apply:
Consider a logistics company contracting a third-party provider to move finished goods, receiving the following annual data: 4,000 tonnes shipped by road over 2,000 km, and 8,000 tonnes shipped by sea over an average of 12,000 nautical miles.
Using the distance-based method:
(4,000 t × 2,000 km × 0.13 kg CO₂e/t-km) + (8,000 t × 12,000 NM × 0.02 kg CO₂e/t-NM) = 1,040,000 + 1,920,000 = 2,960,000 kg CO₂e
This step-by-step baseline can be tracked over time as the company shifts to lower-emission carriers, consolidates shipments, or works with providers using the GLEC methodology.
Category 5 covers emissions from the third-party disposal and treatment of waste generated by the reporting company’s operations. Emissions are recorded in the year the waste is generated, even if physical treatment occurs in a subsequent period.
Common waste types in the logistics sector include:
Treatment routes – landfill, incineration, recycling, composting, waste-to-energy, and wastewater treatment – each carry different emission profiles. Landfill generates methane over time; incineration converts waste mass into combustion gases. The correct emission factor depends on both the waste type and the treatment method applied.
When selecting emission factors, it is important to check the boundary used by the database. The GHG Protocol requires emissions from material recovery to be included in Category 5, but excludes the recycling process itself. That is covered in the Category 1 emissions of the buyer of the recycled product or energy [3].
Where a logistics company tracks different waste streams separately, a hybrid calculation approach balances accuracy with practicality.
Using the waste-type-specific method for tracked streams and the average-data method for mixed waste:
Plastic and other tracked waste: (700 t × 3 kg CO₂e/t) + (750 t × 21 kg CO₂e/t) + (1,500 t × 7 kg CO₂e/t) = 47,250 kg CO₂e
Mixed waste (average-data): (4,300 t × 23 kg CO₂e/t) + (2,000 t × 6.3 kg CO₂e/t) = 111,500 kg CO₂e
This approach prioritises granularity for high-volume materials while using averages where detailed tracking is not yet in place.
Category 6 covers emissions from employee business travel in non-company vehicles. These are flights, trains, taxis, and reimbursed personal cars, with optional inclusion of accommodation where data is available. Category 7 covers home-to-work commuting, estimated using employee surveys that capture round-trip distances, transport modes, and working patterns.
For logistics companies operating large, distributed workforces across depots and hubs, commuting emissions may be more significant than in office-based sectors. Distance-based methods are preferred for both categories where data is available. Spend-based methods serve as a fallback for business travel; average-data methods apply to commuting where survey coverage is limited.
Both categories can also be calculated using the fuel-based method when internal expense or reimbursement records provide access to fuel consumption data.
Category 8 captures emissions from assets leased by the reporting company but not owned or financially controlled by it. In logistics, this commonly includes warehouses and distribution centres under operating leases, leased vehicles, refrigerated trailers, and material-handling equipment.
Whether these emissions are reported under Scope 1, Scope 2, or Category 8 depends on two factors: the type of lease and the organisational boundary approach used. Under the equity share or financial control approach, operating leases typically result in emissions being reported under Category 8. Under the operational control approach, the same leased assets are generally reported under Scope 1 and 2 instead [3].
The emissions accounted for in Category 8 are operational: fuel combustion, purchased electricity, and fugitive refrigerant emissions. Embodied emissions from the manufacture of the leased asset fall under Categories 1 or 2, not Category 8.
Consider a logistics company leasing 1,200 m² within a 9,600 m² distribution facility for six months. The facility owner reports total natural gas consumption of 630,000 m³ and electricity consumption of 800,000 kWh across the full building for the year.
Using the lessor-specific method, allocating by floor area and occupancy duration:
[(630,000 m³ × 1.88 kg CO₂e/m³) + (800,000 kWh × 0.48 kg CO₂e/kWh)] × (1,200 m²/9,600 m²) / 2 = 28,025 kg CO₂e
Even without dedicated sub-meters, this proportional allocation provides a defensible estimate that can be disclosed and improved as better data becomes available.
Accurate upstream Scope 3 accounting is essential for credible sustainability reporting and effective climate risk management in logistics.
The sector carries a specific commercial dimension that other industries face less directly. When manufacturers and retailers calculate their own Scope 3 Category 4 emissions, the logistics provider is the direct data source. The quality of a logistics company’s emissions inventory therefore shapes the accuracy of its customers’ climate disclosures. This creates a commercial incentive to measure well, not only to comply.
Applying the GHG Protocol’s five core principles of relevance, completeness, consistency, transparency, and accuracy, and prioritising high-quality data collection and supplier engagement, enables logistics companies to build inventories that drive informed decisions and targeted action. Focusing on upstream hot spots in Categories 3 and 4 reveals the highest-impact opportunities: shifting to lower-emission transport modes, electrifying fleets, consolidating shipments, decarbonising warehousing operations, and engaging subcontractors on data sharing and reduction commitments.
“An inventory is a diagnostic tool. The value of building it well is that it shows exactly where to intervene: which transport modes to shift, which subcontractors to engage, which fuel transitions will move the needle most. Accurate upstream accounting turns a compliance obligation into a decarbonisation roadmap.”
Nexio Projects is a pure-play sustainability and climate consultancy, recognised as one of the top ESG consultancies by Consultancy.nl and Verdantix. We support more than 100 clients in building full GHG inventories and mapping their decarbonisation journey across Scope 1, Scope 2, and Scope 3 emissions.
A team of highly skilled climate experts brings in-depth knowledge of company processes and data architecture to design and implement tailored decarbonisation strategies. With experience across more than 20 sectors including logistics and supply chain as a core area of expertise, Nexio Projects helps organisations move from measurement to implementation. We turn complex emissions data into practical actions that accelerate Scope 3 reductions across the value chain.
If you are interested in further support, contact us for a free consultation call!
Sign up to our newsletter and learn more about sector best practices, tailored strategies and news!
[1] CDP. Corporates’ supply chain scope 3 emissions are 26 times higher than their operational emissions. https://www.cdp.net/en/press-releases/corporates-supply-chain-scope-3-emissions-are-26-times-higher-than-their-operational-emissions. Accessed April 2026.
[2] Bauer, R., Radojcic, T., Herold, D.M. and Kummer, S. (2026) ‘Exploring the development of Scope 3 emissions reporting: Evidence from global logistics companies’, Cleaner Logistics and Supply Chain, 18. Available at: https://www.sciencedirect.com/science/article/pii/S2772390926000090 (Accessed: 21 April 2026).
[3] GHG Protocol. Corporate Value Chain (Scope 3) Accounting and Reporting Standard. https://ghgprotocol.org/scope-3-standard. Accessed April 2026.
[4] Science Based Targets initiative (SBTi). Corporate Net-Zero Standard, Version 1.2. https://sciencebasedtargets.org/net-zero. Accessed April 2026.
[5] Smart Freight Centre. Global Logistics Emissions Council (GLEC) Framework for Logistics Emissions Accounting and Reporting, v3.0. https://www.smartfreightcentre.org/en/our-programs/global-logistics-emissions-council/calculate-report-glec-framework/. Accessed April 2026.
[6] UK Government / DEFRA. Greenhouse Gas Reporting: Conversion Factors 2024. https://www.gov.uk/government/collections/government-conversion-factors-for-company-reporting. Accessed April 2026.
[7] IEA. Greenhouse Gas Emissions from Energy. https://www.iea.org/data-and-statistics/data-product/greenhouse-gas-emissions-from-energy. Accessed April 2026.